Waveform
Waveform
Overview
The Waveform add-in allows for the creation of a graphical representation of the amplitude of the soundtrack attached to a sequence. This can be in the form of either a single channel that has the cell intensity vary with the amplitude. Or a bar-graph style display using a range of channels.
Components of Waveform add-in
Waveform add-in screen
Waveform representation
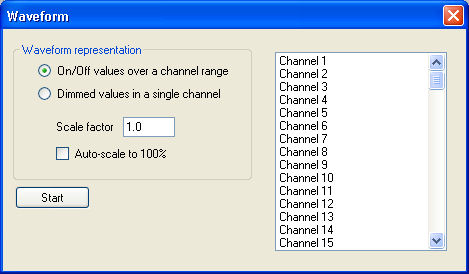
These are the options for the mode of operation of the waveform add-in.
On/Off over channel range
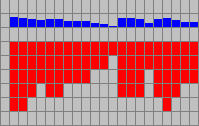
This is the option that generates a bar graph style representation of the amplitude of the soundtrack associated with the sequence. The intensity of the of the individual cells in the bar graph are set to 100%.
Dimmed values in single channel
This is the option that as its name implies uses a single channel that contains cells of varying intensity corresponding to the amplitude of the soundtrack.
Channel selection
This is where you select the channel(s) to use with the waveform display.
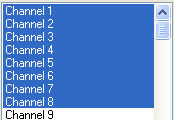
When selecting a range of channels for use with the On/Off values option, those channels must be in a single block. If you skip any channels the add-in will only work with the first group of channels it sees and will ignore the remainder you have selected.
The Dimmed values option will only allow you to select a single channel.
Auto scale
Selecting auto scale means that the add-in will ensure that only loudest sections of the soundtrack will be set 100% intensity for Dimmed value mode, or all channels of the range mode will be on.
Scale factor
When auto-scale is not selected the scale factor can be manually adjusted.
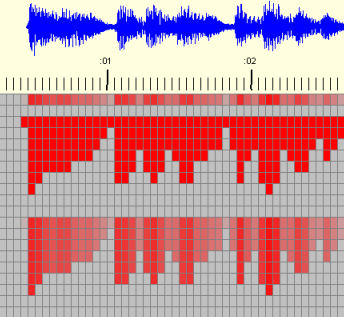
The above series of screen shots shows the audio visualiser representation of a section of the soundtrack attached to a sequence and the corresponding outputs from the waveform add-in. Firstly with auto scale selected, secondly a small scale factor entered, and finally with a large scale factor entered.
Completing the process
Once you have made your choices, click on the start button and the add-in will write data into the selected channel(s).
Advanced programming tips
Dimming bar graph
The cells of the bar graph waveform display are created at 100% intensity. By combining the dimming display with the bar graph display you can create a dimming bar graph.
To do this you need to create both the dimming and the bar graph displays. Select and copy the channel containing the dimming display. Then Paste Boolean AND that information over each of the channels of the bar graph display ( as shown above).
Peak bar graph
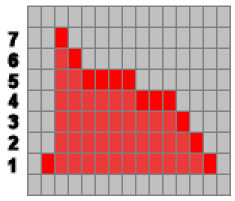
Comparison of standard bar graph to peak bar graph (note: shown vertically mirrored for clarity)
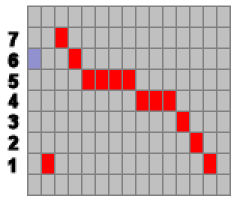
The bar graph that is produced by the waveform add-in is a solid bar graph. This can be converted to a display where only the top most cell of the bar is displayed.
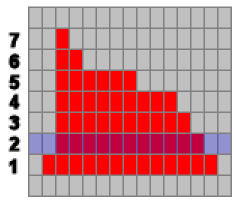
As shown in the image above, select and copy the row 2 information. Then select row 1 and use the Paste Boolean XOR function to overwrite row 1. Make sure the column you start the copy from is the same column you paste to.
In the image above you can see that cells in row 1 have now been set to 0% where they are beneath cells in row 2 that are at 100%.
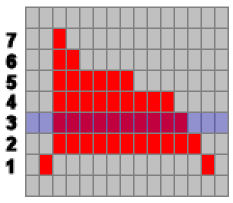
Next select and copy row 3 and use Paste Boolean XOR to overwrite row 2.
In the image above row 2 has now been converted.
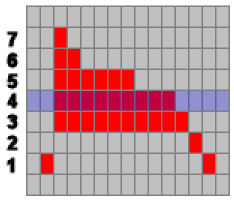
Continue the process. Copy row 4 and paste boolean XOR with row 3. In the example shown, the process concludes when eventually row 7 is copied and boolean XOR pasted to row 6.
The final result.
Taking it further
You can combine the procedures to create composite displays. For example, a peak display superimposed over a standard bar graph (that has been reduced in intensity).
